SHRP2 Reliability Archive By Kavya Sambana
SHRP2 Reliability Archive
“Facilitating open data exchange in transportation research for today, and tomorrow”
The SHRP2 Reliability Archive (http://shrp2archive.org/) is a repository of rich data and information from over 45 SHRP2 Reliability and Reliability-related projects. The Archive contains various resources, including raw datasets, analysis results, tools and models, and documentation from these projects. The SHRP2 Reliability Archive makes these artifacts easily accessible to researchers and practitioners online to facilitate future research.
The SHRP2 Archive is a user interactive repository that enables:
-
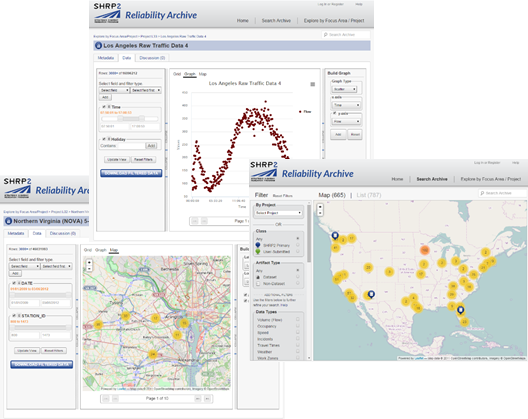
Searching artifacts and associated metadata easily in a list view or visually on a map;
-
Downloading artifacts, including user-selected subsets of the datasets;
-
Collaboration between multiple researchers via comments; and
-
Visualizing user-selected data in graphical charts.
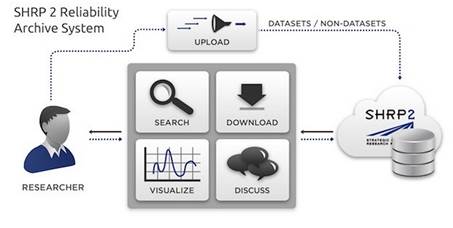
The Archive was created to provide an open and accessible data hub at a single location to store and make available transportation data to the research community for years to come. The Archive is free for users to search, visualize, and download travel time reliability-related data. The Archive has grown to a size of over 2 terabytes of data and can be a useful source of data for researchers in traffic operations, roadway safety, and regional/corridor analysis.
The Archive has several types of visualization for users to preview and evaluate whether a data set is of interest. A user can visualize the first 300 records of a data set in a tabular format. On a map of highway facilities, reminiscent of a GPS navigation map, a user can see the precise location of the traffic detectors used to collect to the data. Additionally, a user can graph the relationships between different numerical fields in the dataset, such as a scatter plot of the relationship between flow and occupancy.
The data on the Archive may be helpful for your transportation research or policy projects. If you haven’t visited the site, why not explore the data and visualizations today?