Delivering resources to save time, lives, and money

L03 Data Sources Diagram

Overview

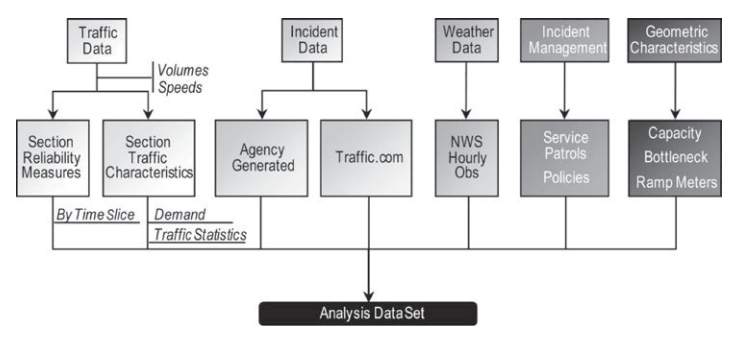
This diagram corresponds to Figure ES.2. in the SHRP2 report titled "Analytical Procedures for Determining the Impacts of Reliability Mitigation Strategies". It illustrates how several data sources came together as part of the SHRP2-L03 project. The Archive includes this very large L03 data set, most of which covered urban freeways and which was assembled from various traffic management centers. A separate data set for urban freeways was compiled for the Seattle area for the congestion by source analysis.

Operations Area of Practice

    SHRP2 Tools
    Simulation Analysis
    Data Acquisition, Support and Hosting
    Travel Demand Forecasting

Content Type

Informational Product

Role in Organization

Transportation Planner
Public
Senior Engineer
Researcher/Academic
Principal Engineer
Manager / First Line Supervisor
Director / Program Manager
CEO / GM / Commissioner
Engineer
Senior Manager
Transit Professional
Associate Engineer

Publishing Organization

SHRP2 Program

Project Website

TOM Chapters
6.5
View Related
Issue Date